Signal Vault is your network's long-term memory. It ingests, retains, correlates, and visualizes packet metadata captured by Allegro Packets appliances to provide deep historical packet analysis and automated AI diagnostics.
Engineered specifically for networks running
The continuous data lifecycle from high-fidelity collection to deep forensic analysis.
Continuous data-flow acquisition.
Long-term structured storage and visibility.
Instant visualization and monitoring.
Advanced intelligence and anomaly detection.
Actionable engineering and executive insight.
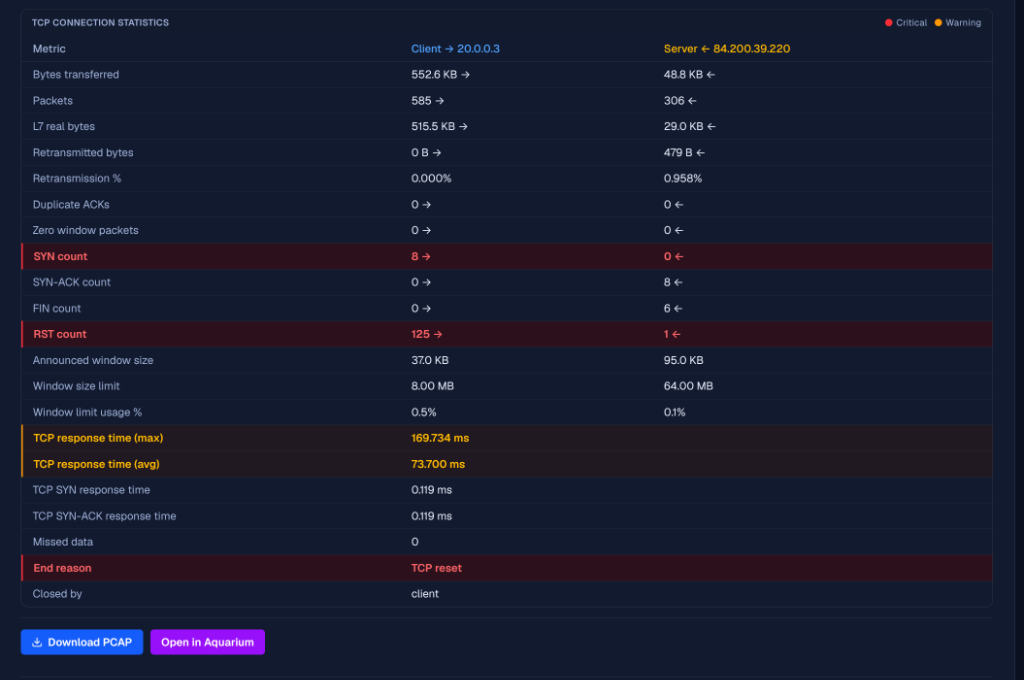
Forensic transaction mapping with Aquarium.
Allegro Network Multimeters capture network truth live. Signal Vault keeps that truth, layering historical context, retention, and AI automation on top of it.
Signal Vault consumes flow records, PCAP exports, and metrics the Allegro Network Multimeter already produces. No new taps, no new hardware. Unlocks your data.
The appliance excels at live/recent analysis; Signal Vault stores months of metadata so you can investigate incidents that happened days or weeks ago and track trends.
Instead of paging through appliance UIs per-incident, get pre-built cross-filtered dashboards, custom visualizations, and AI summaries that point directly to the cause.
Give NOC, operations, and management read-only, shareable, PDF-exportable dashboards without handing everyone full admin access to the capture appliance itself.
Signal Vault layers LLM-driven analysis on actual packet-derived facts. Diagnostic insights are firmly grounded in captured data, not guesses or generic templates.
Ready to deploy?
Already running Allegro Packets? Signal Vault is the analytics layer you've been missing.
Deploy Companion LayerFrom layer-7 metadata search to local AI threat analysis, Signal Vault provides the complete network forensics toolkit.
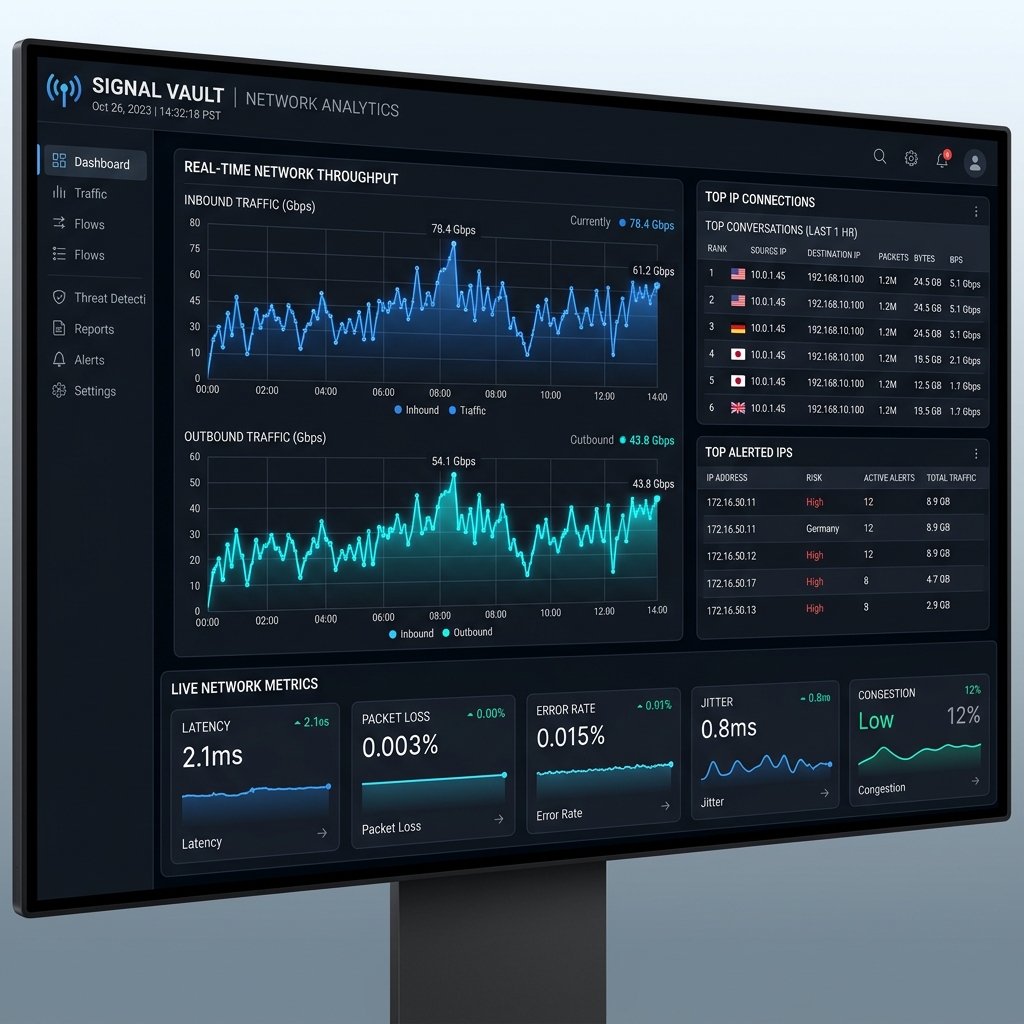
Centralized view featuring total flow rates, throughput (Gbps RX/TX), top conversations, and interactive traffic-over-time charts with selection zooming.
Real-time geolocation of active external connections. Interactive global layout showing data paths and traffic flow speeds across continents.
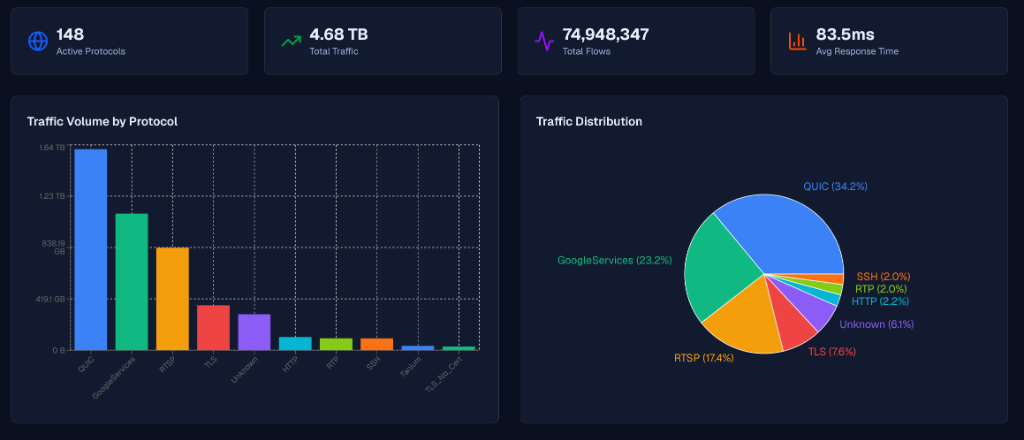
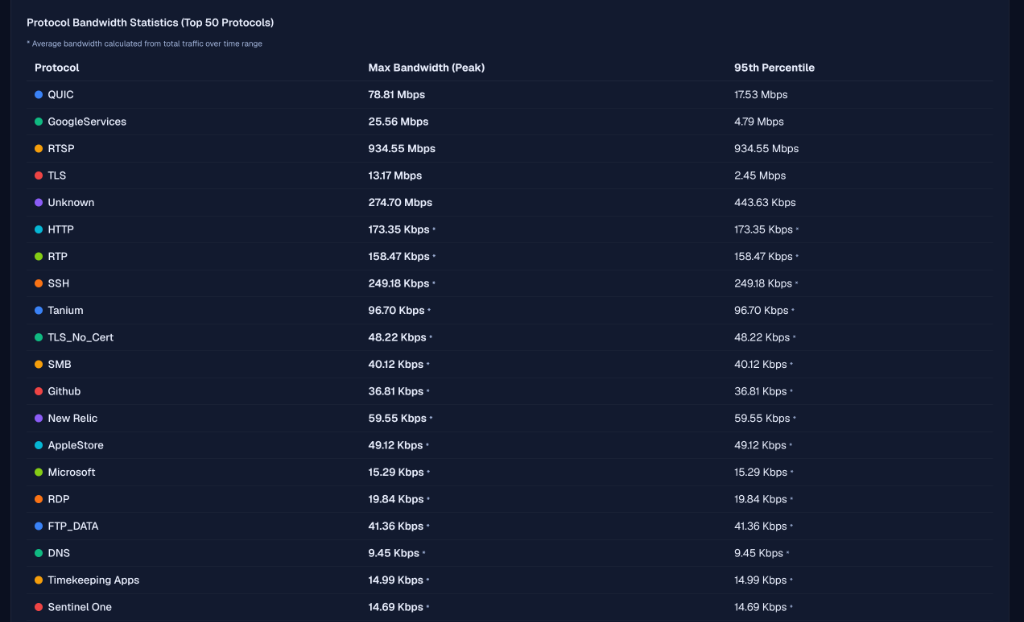
Deep Layer-7 breakdown including bytes, flow count, unique client-server pairs, and application response times for all monitored protocols.
Aggregated HTTP request/response metrics, status codes, query strings, user-agent profiles, and latency analysis for web services.
Granular tracking of network latency, TCP handshake times, application server response delay, and throughput trends over time.
Real-time tracking of SIP call setup times, packet jitter, packet loss rate, and MOS call quality scores for voice networks.
Detailed flow duration, packet arrival interval, teardown delays, and timestamp audits for precise connection forensics.
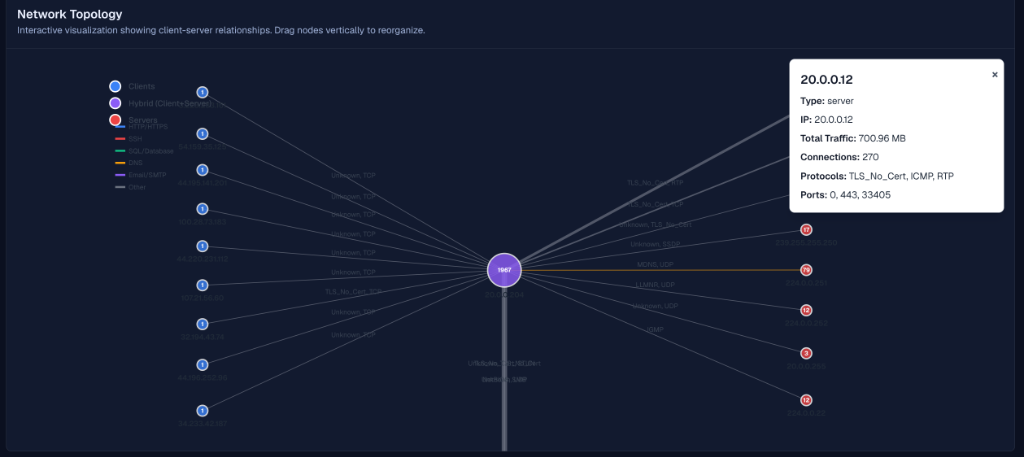
Graph view mapping client devices to backend services, database nodes, and cloud API dependencies based on observed connections.
Isolate anomalous routing paths, traffic policy mismatches, unconfigured subnet flows, and unexpected outbound data transfers immediately.
Audit cipher suites, active SSL/TLS versions, certificate issuers, and track approaching certificate expiration dates.
Logically group subnets and analyze traffic profiles crossing department limits or administrative policy boundaries (e.g. PCI vs Corporate).
Automatically detect, classify, and isolate traffic connecting to Google edge caching endpoints for clean ISP cost audits.
Continual scanning of active packet records using local LLM integration. Provides plain English summaries of system anomalies.
Upload historical capture data to evaluate network anomalies and identify root cause indicators days after the incident.
Directly import external standard PCAP files, filtered automatically by start/end times, to parse and display statistics.
Click any dashboard metric, client IP, or application to immediately restrict and recalculate metrics across all dashboards.
Generate and download comprehensive read-only PDF summaries of network health status for team audits.
At-a-glance system status using composite scoring metrics of latency, error codes, packet retransmissions, and jitter.
Audit resolver latency, query type breakdowns, domain registration checks, and flag malicious domain queries.
Deep profile analysis per MAC/IP address. Displays behavior trends, typical peak usage, and anomalous behavior.
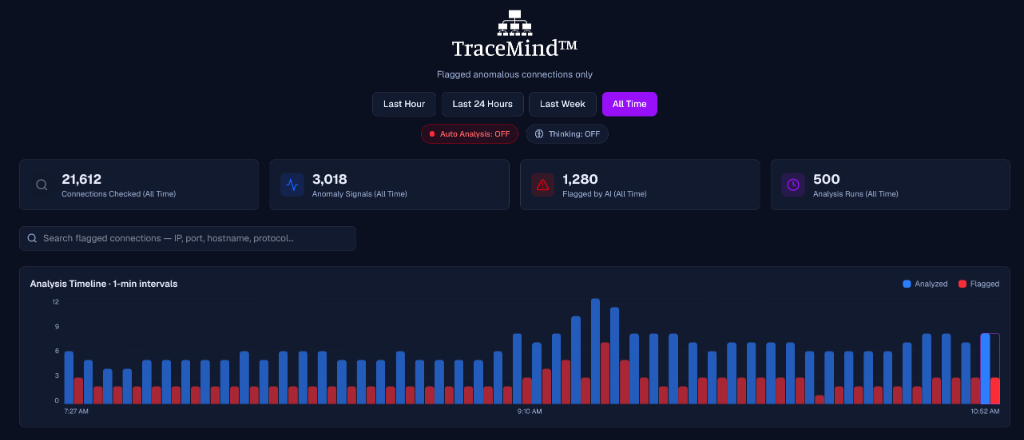
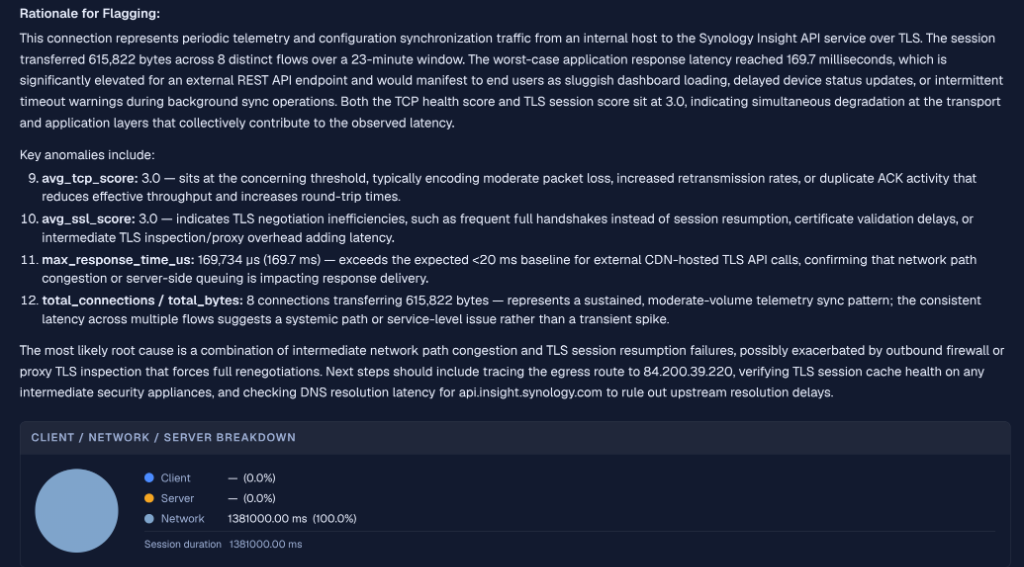
TraceMind scans packet streams and metadata to identify anomalous activity without complex manual configuration. Powered by local LLM technology, your packet-derived facts remain inside your secure network perimeter.
Zero Cloud Leakage: Your sensitive IP addresses and traffic payload details remain private.
Explainable Insights: Generates easy-to-read incident write-ups with connection breakdowns.

Review the high-fidelity dashboards and specialized analytical tools built to store, parse, and analyze your network telemetry.
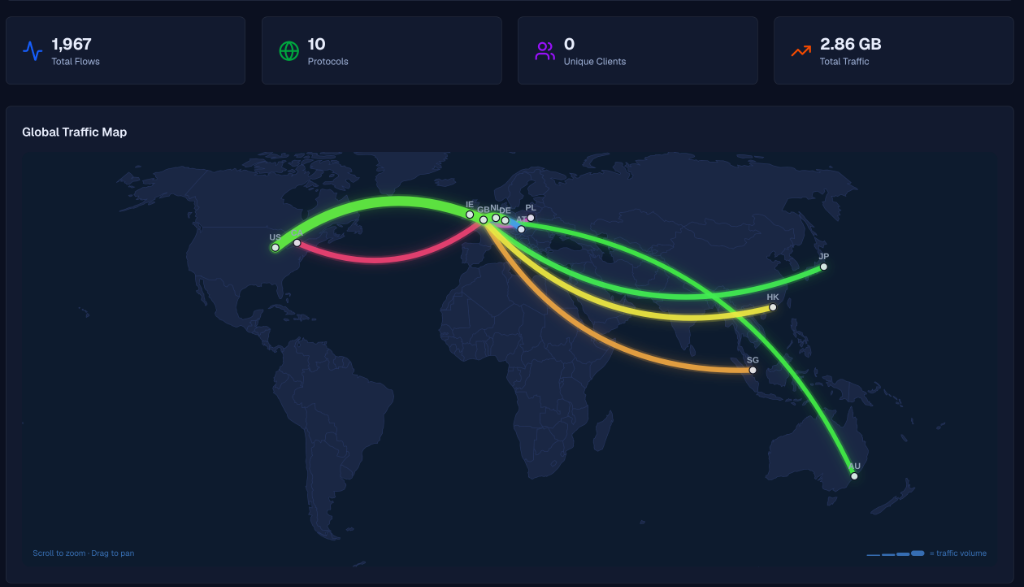
Visualizes connections to global endpoints with reactive maps and bandwidth usage summaries based on geographical location.
Unlock the full capability of Signal Vault with specialized analysis and repository layers.
Built-in Auto AI Analysis
TraceMind is the native AI analyst of Signal Vault. Scanning continuously, it reviews connections on live or offline streams to summarize latency patterns, flag routing anomalies, and detail connection bottlenecks using local LLMs.
Enterprise Packet Repository
Aquarium is our upcoming historical packet indexing and long-term search vault, enabling teams to query multiple petabytes of raw packets with sub-second retrieval times.
Start correlating packet telemetry from your Allegro appliances in minutes. Run historical audits and local AI analysis immediately.