Aquarium turns a raw packet capture into clear answers β it inspects packets, models exactly where time was lost, decodes application-layer transactions without decryption, maps host dependencies, and uses a local AI to write a prioritized root-cause report. Nothing ever leaves your network.
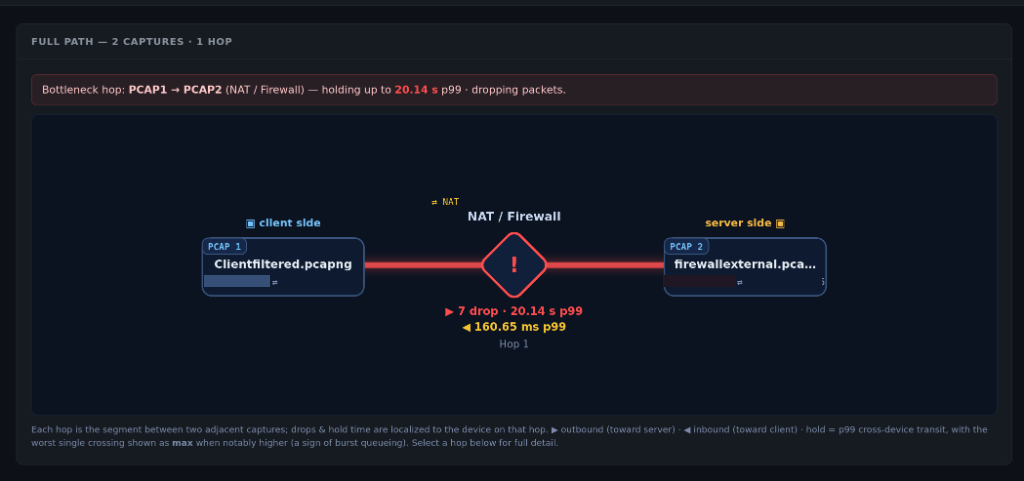
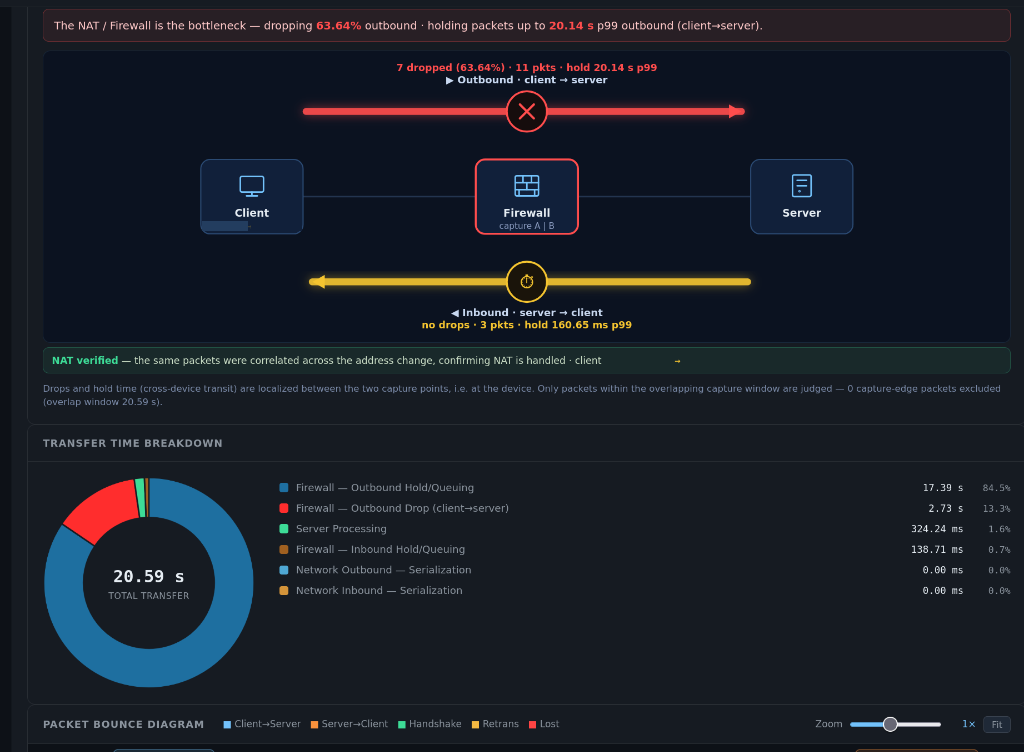
Correlate multi-point packet captures along the transit path. Pinpoint the exact device in your infrastructure that is causing delay or dropping packets.
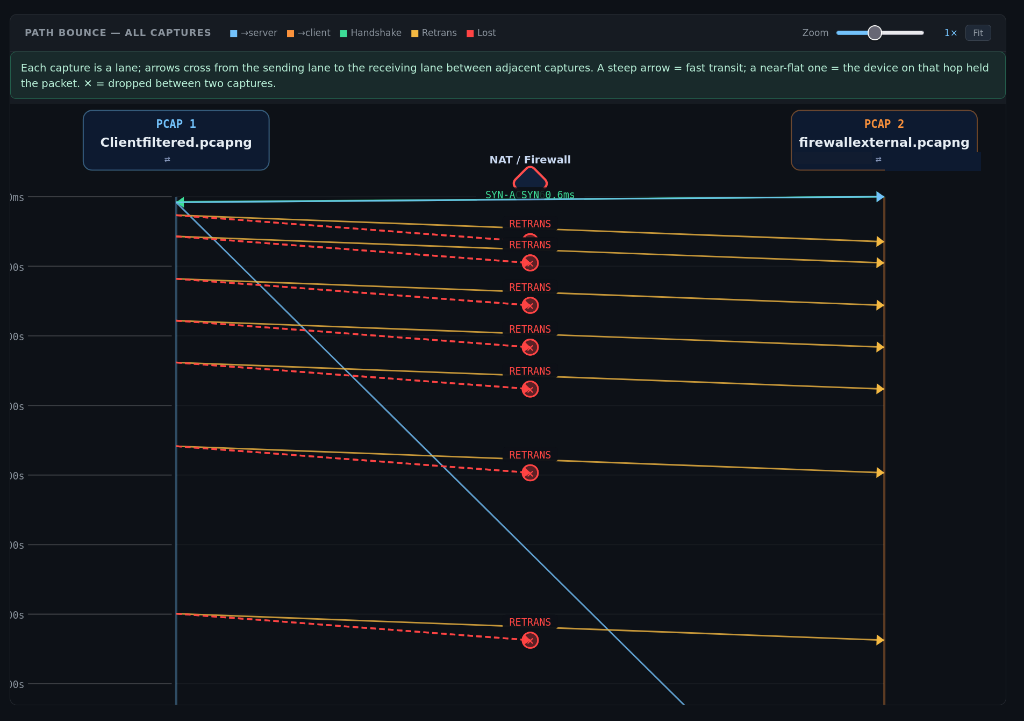
Aquarium's unique PathTraceβ’ capability allows engineers to correlate multi-point packet captures along the transit path. By aligning timestamps across captures from Wireshark to tcpdump on any device that can produce standard PCAP files, PathTrace maps out the exact route.
It works seamlessly with Allegro's Edge Visibility agent for easy packet captures at the edge, allowing you to instantly isolate bottlenecks, clock skew, and packet drops between hops.
From raw bytes to root-cause report β Aquarium covers every layer of analysis without exporting a single packet.
A fast, tshark-powered packet list with full display filter support. Drill from a high-level flow view down to individual bytes β right in the browser.
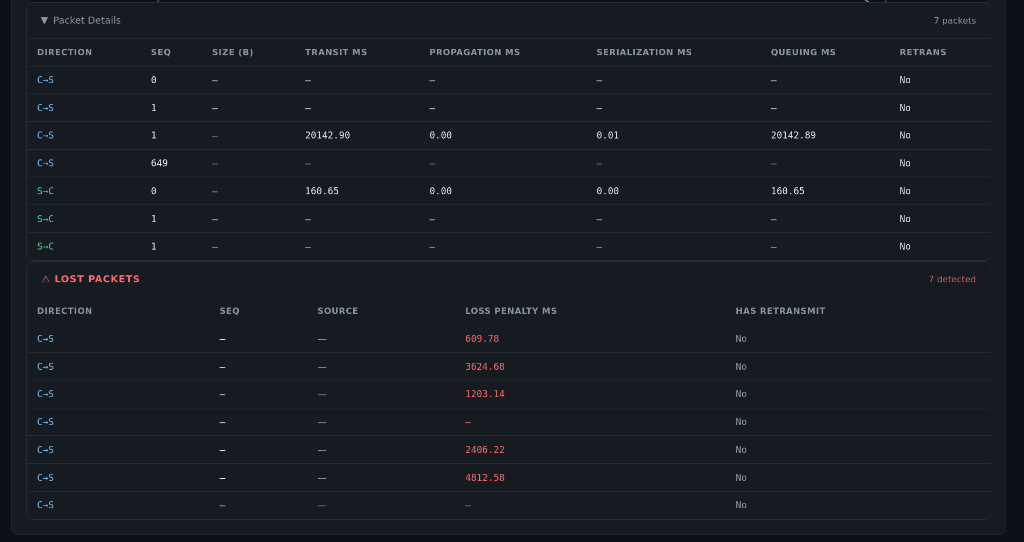
A clean client β server ladder showing the full conversation packet by packet β exactly when each segment was sent and when its ACK arrived.
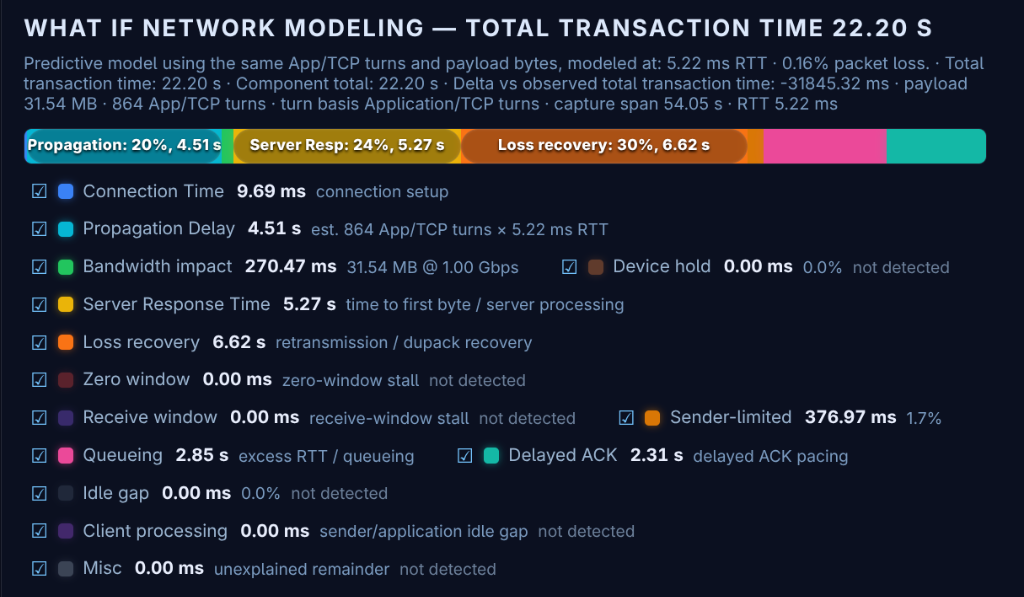
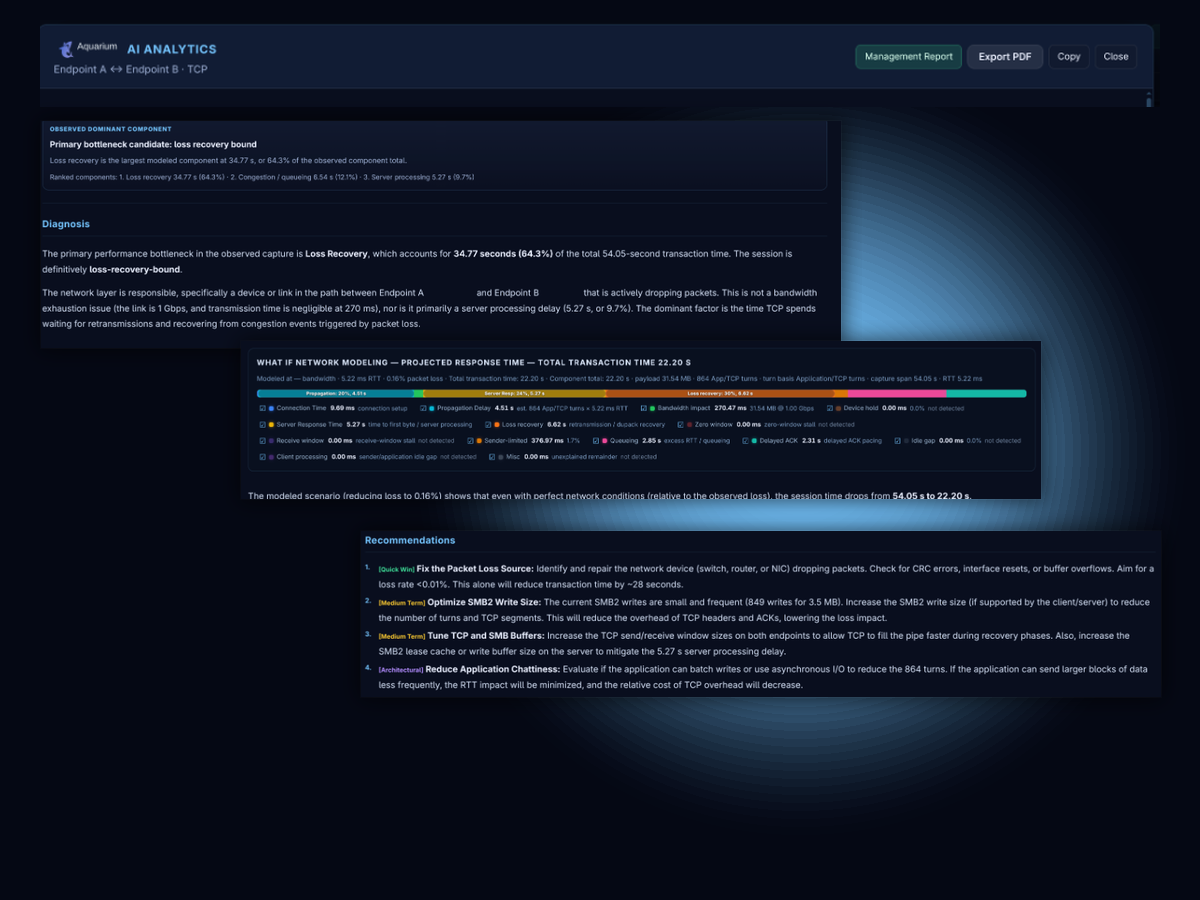
Deterministic breakdown of where the time went: connection setup, propagation, server processing, data transfer, loss recovery, congestion, zero-window, delayed-ACK. Plus What-If modeling β drag RTT and bandwidth sliders and watch bottlenecks shift in real time.
Decodes SMB1, SMB2, TLS record-level turns, Oracle SQL*Net/TNS (recovering clear-text SQL), and HTTP β all without touching a private key. Per-operation breakdown, service times, byte counts, and a per-transaction waterfall.
Scatter plots, p50/p95/p99 percentile bands, histogram, CDF β with automatic slow-tail and anomaly flagging. Know exactly which transactions are dragging your averages down.
A host-to-host traffic matrix: who talks to whom, how much, and at what latency β fully filterable. Spot unexpected talkers and unplanned dependencies instantly.
Generates dual-audience reports locally on your server. Engineers get low-level timing profiles and trace correlations, while managers get clear business impact summaries and prioritized action items β all 100% on-premise.
Capture the same transaction at multiple points along the path. Aquarium correlates packet timestamps across capture points to measure real cross-device transit time, localize loss to a specific hop, and detect clock skew β ground truth, not single-vantage guesswork.
Self-hosted in Docker. Local accounts with role-based admin, full audit trail of logins and PCAP uploads, configurable per-user idle auto-logout. Your captures β and your AI β never leave your infrastructure.
No agents, no cloud pipelines, no configuration sprawl β just a capture file and answers.
Drag-and-drop any capture file β from Wireshark, tcpdump, or a tap β directly into the browser. Aquarium indexes it instantly.
Secure uploadExplore the packet list, bounce diagram, delay model, application transactions, dependency map, and response-time analytics β all rendered locally in your browser.
8 analysis viewsYour on-prem LLM reads the combined context, correlates across layers, and generates a structured findings report β PDF export in one click, dark theme preserved.
PDF exportRich, interactive charts built for network engineers β not dashboards stitched together from generic BI tools.
Translate raw packet captures into structured, business-ready diagnostics. Instantly pivot between technical root-cause trace analysis and non-technical management summaries.
Stop spending hours translating Wireshark details into management summaries. Aquarium's on-premises AI analyzes packet timing anomalies, application transactions, and path delays to generate tailored views for your entire organization:
Detailed analysis of TCP Congestion Sawtooth Spirals, application-layer write latency profiles, and packet loss recovery metrics, coupled with exact buffer tuning guidelines.
A jargon-free executive overview focusing on application response times, business SLA impacts, and a simplified timeline of concrete remediation next steps.
Aquarium is designed from the ground up for air-gapped and data-sensitive environments. The AI model runs locally β no packets, no summaries, no telemetry ever traverse the internet.
Request a demo and we'll walk you through a live analysis of your own capture file β on your infrastructure, on your schedule.